01 / 06
A market read on the home page.
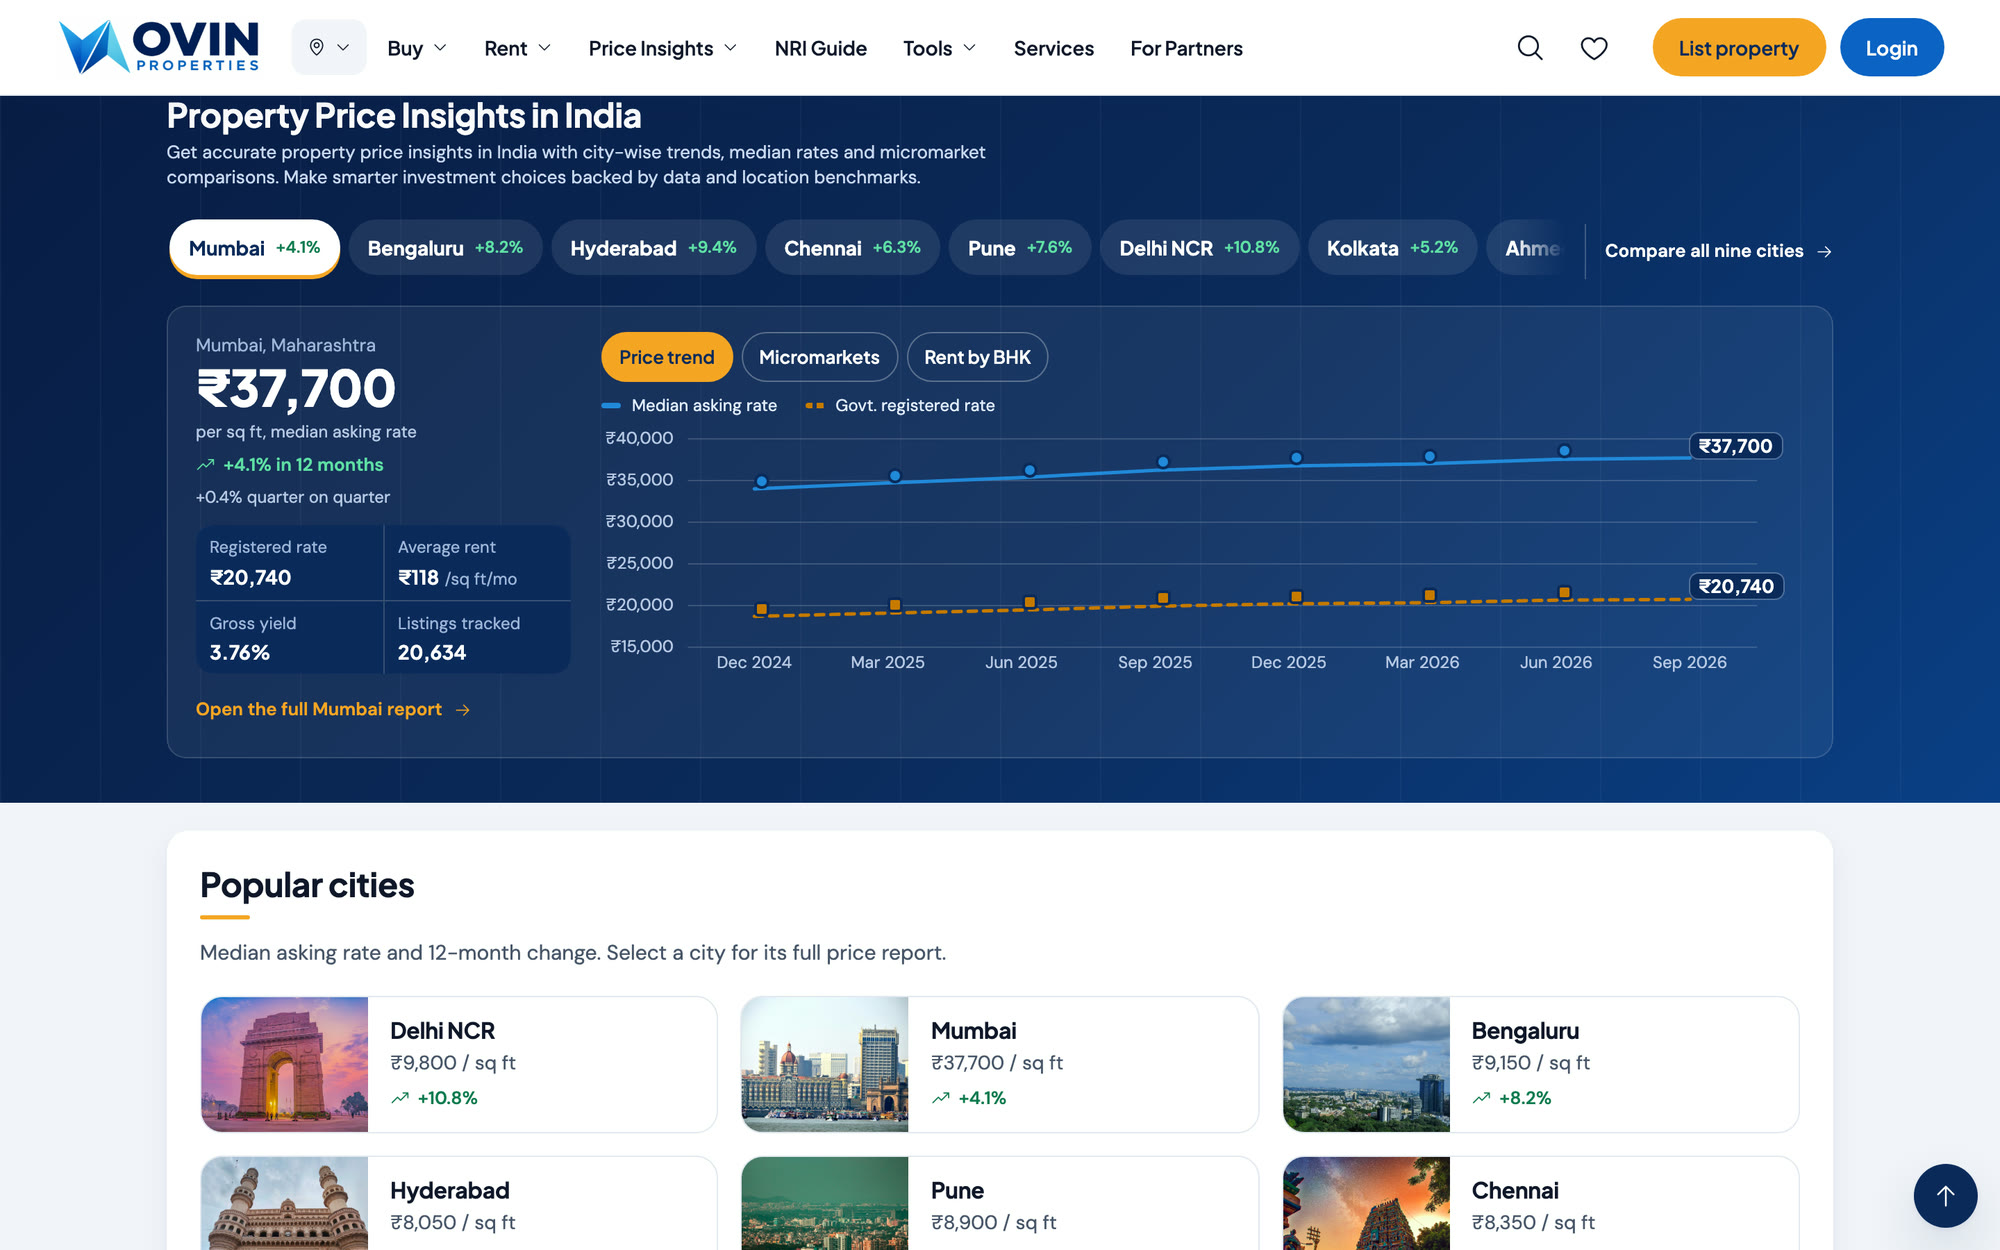
Pick a city and the board shows the median rate, how it moved over a year, rent per square foot and the gap between asking and registered prices, with a one-click path to the full city report.
Case study · Real estate
We designed and built a property platform that helps Indians abroad compare cities, localities and homes with confidence.
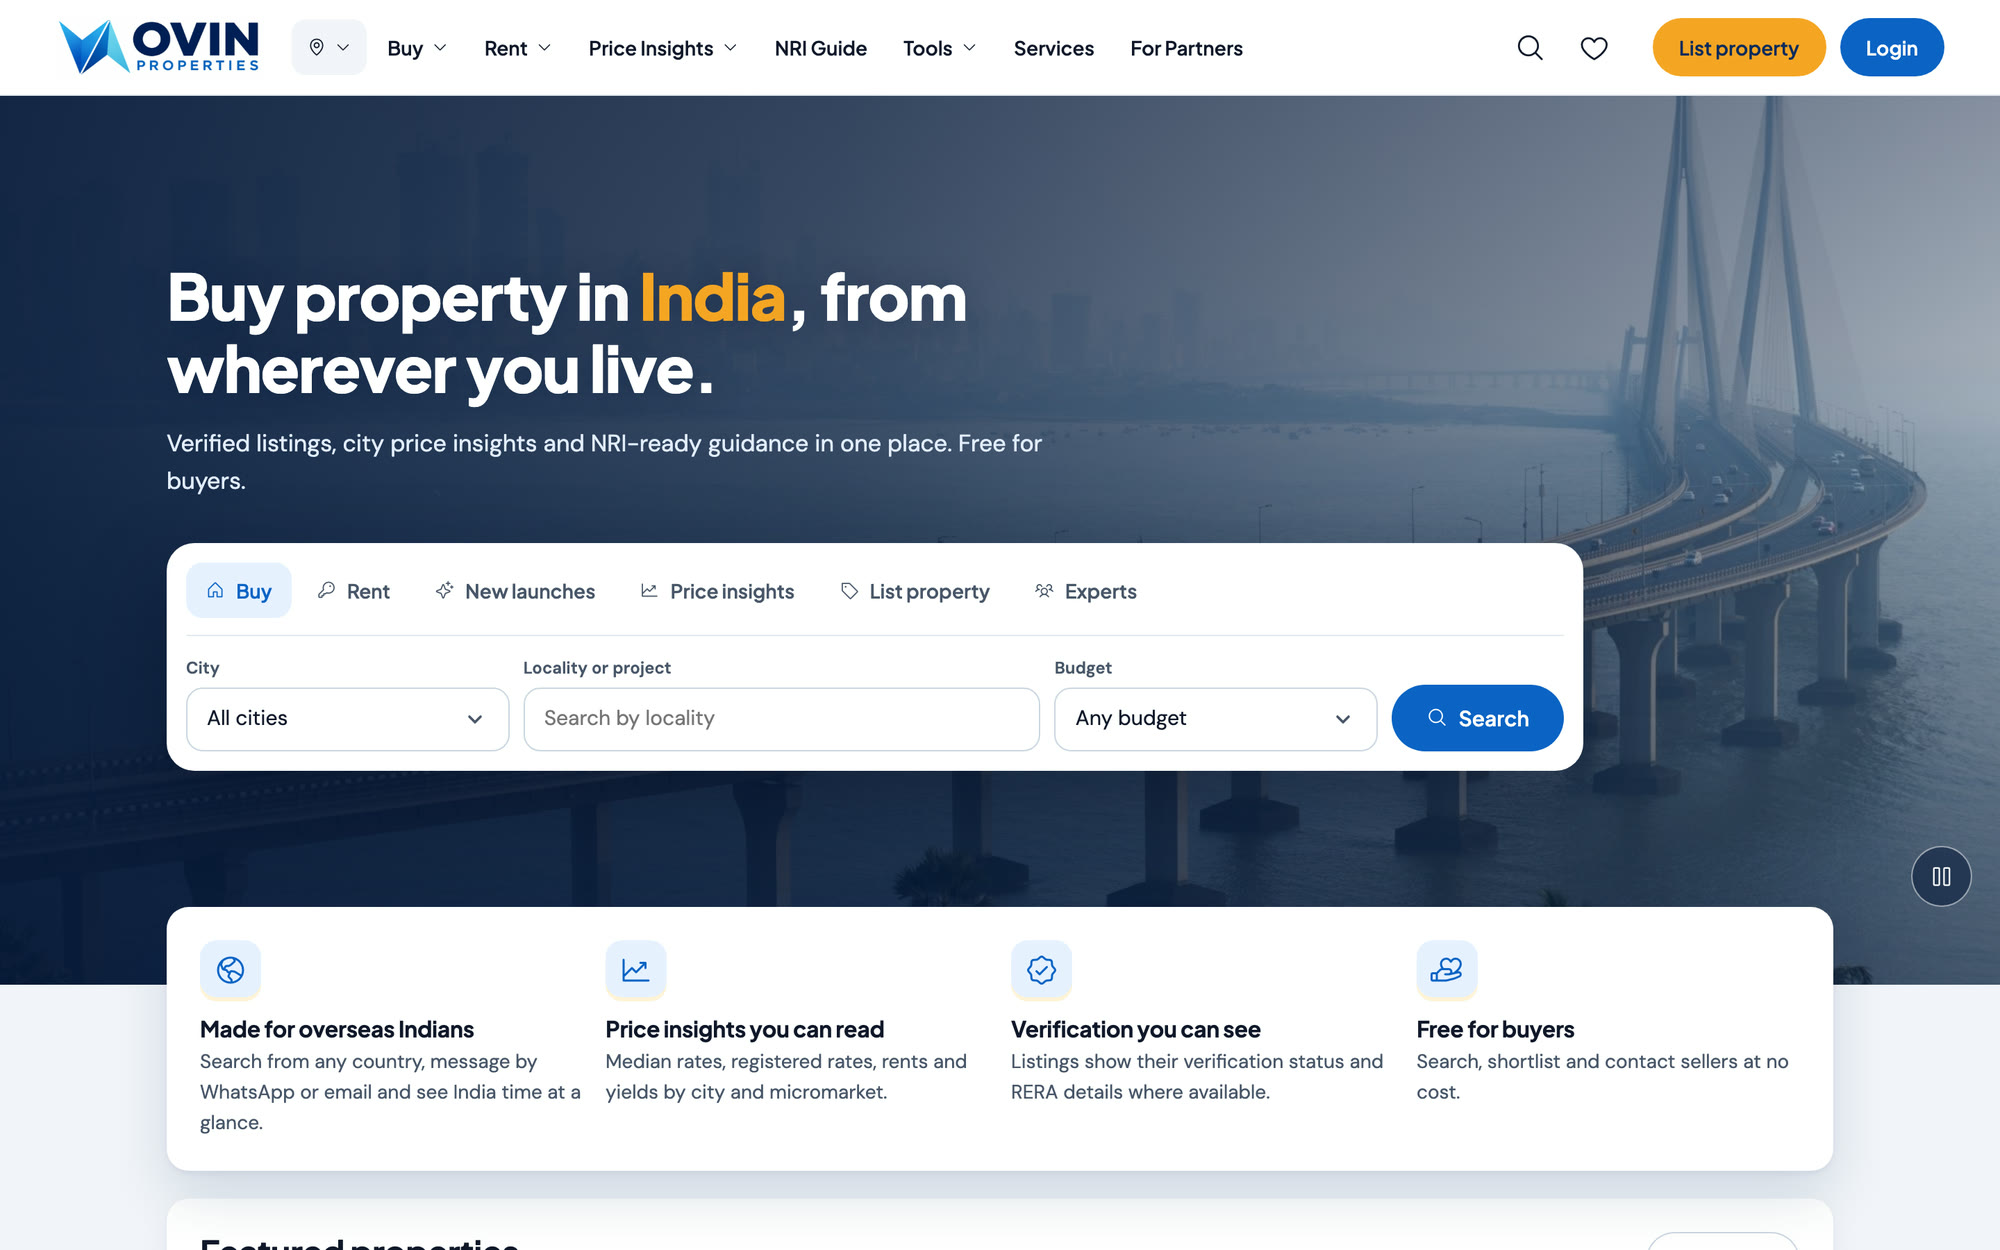
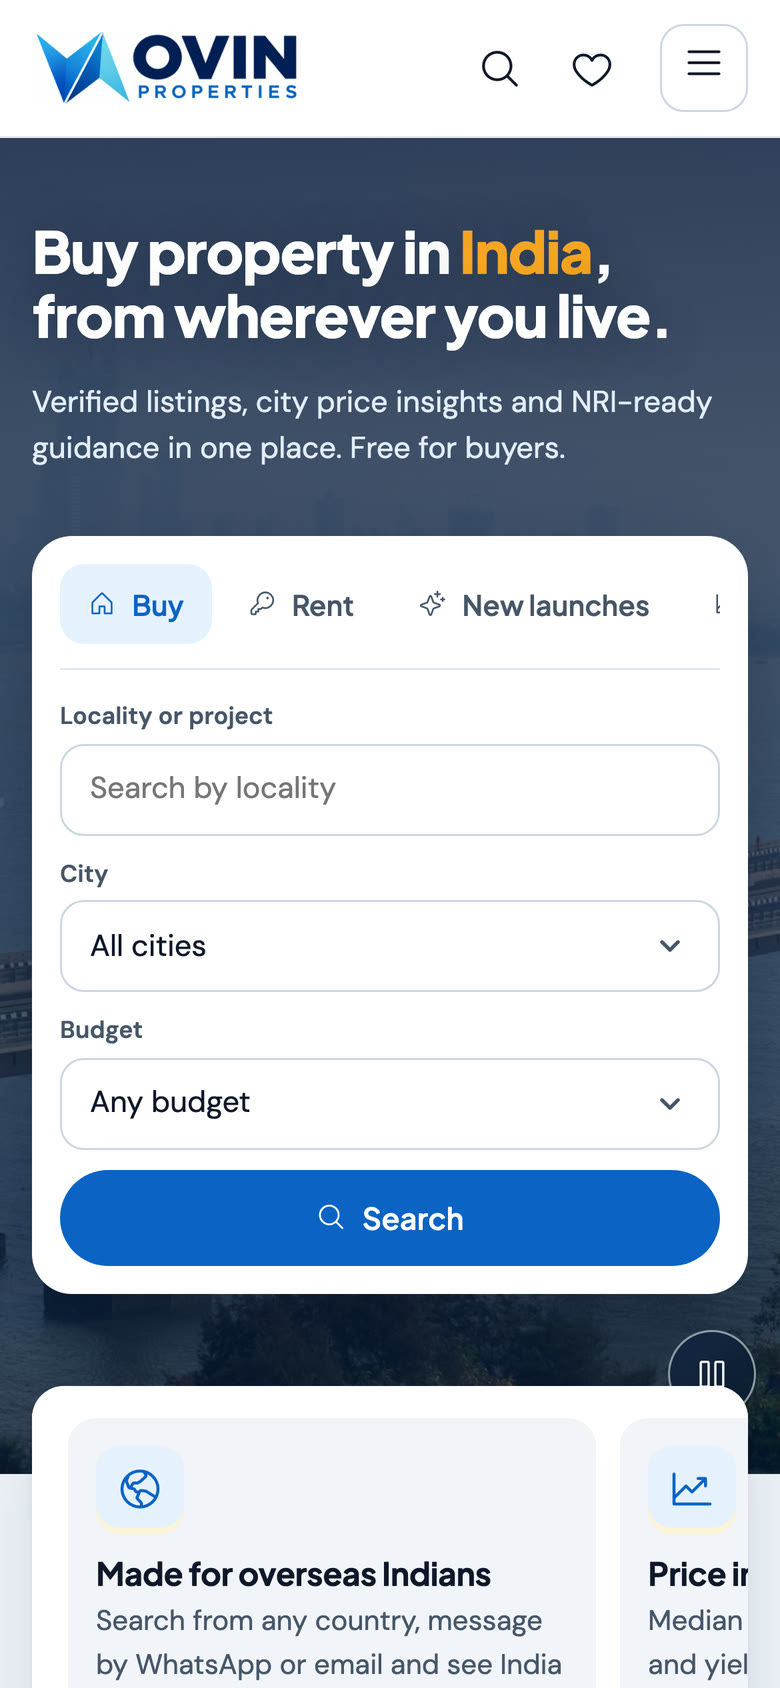
OVIN Properties serves Indians who live abroad and want to buy, invest in or manage property back home. They can't drop in on a site visit, they work in a different time zone, and the numbers they find online rarely agree with each other.
OVIN wanted one place where an overseas buyer could understand a market before talking to anyone: what homes really cost, how prices are moving, what a property earns in rent, and what the rules are for NRIs.
An overseas Indian should be able to judge a city, a locality and a home from their sofa abroad.
Asking prices, registered prices and rents sit in different places, so buyers can't tell a fair deal from a hopeful one.
Overseas buyers make decisions from photos and calls, so every page has to answer the questions a site visit would.
NRIs, OCIs and residents follow different rules on what they can buy, how they pay and what tax applies.
EMI, affordability, yield and currency maths usually live on five different websites.
A buyer in Dubai or Toronto needs to know when someone in India can actually reply.
Every screen had one job: help someone far from India make a confident decision without being pushed.
We turned OVIN's proposal and requirement documents into one site map, with price insights as the centrepiece.
One plan, 36 pagesWe built a visual system from OVIN's logo: two blues and a navy for trust, one warm amber for the next step, and type that makes numbers easy to read.
A system from one logoOne chart palette checked for colour blindness, plain labels, and a table view behind every chart.
Charts anyone can readEvery page is generated from a single data file, so a live market feed can replace it without a redesign.
9 cities, 12 properties, 1 data fileEvery internal link and anchor checked, every page type tested on phones, motion that respects reduced-motion settings.
2,990 links checkedBrand and design
OVIN is the property brand of Vivin Facilitators, working from the UAE and Canada for Indians abroad. The design takes its cues from the logo: calm blues and navy that feel like a bank, with one warm accent that always points to the next step.

A light grey canvas with white cards, so every number sits on its own surface and reads like a statement.
Verification badges, plain labels and a visible note wherever a figure is illustrative. Nothing is hidden in small print.
Amber appears only on the actions that move a buyer forward and on the key word in each headline.
Tabular figures, a colour-safe chart pair (blue and amber) and a table behind every chart.
#0B2A5BHero, footer, headings#0B63C5Links, charts, primary#22B8E6Logo highlight#F5A524Next-step actions#F1F4F9Page background01 / 06
Pick a city and the board shows the median rate, how it moved over a year, rent per square foot and the gap between asking and registered prices, with a one-click path to the full city report.
02 / 06
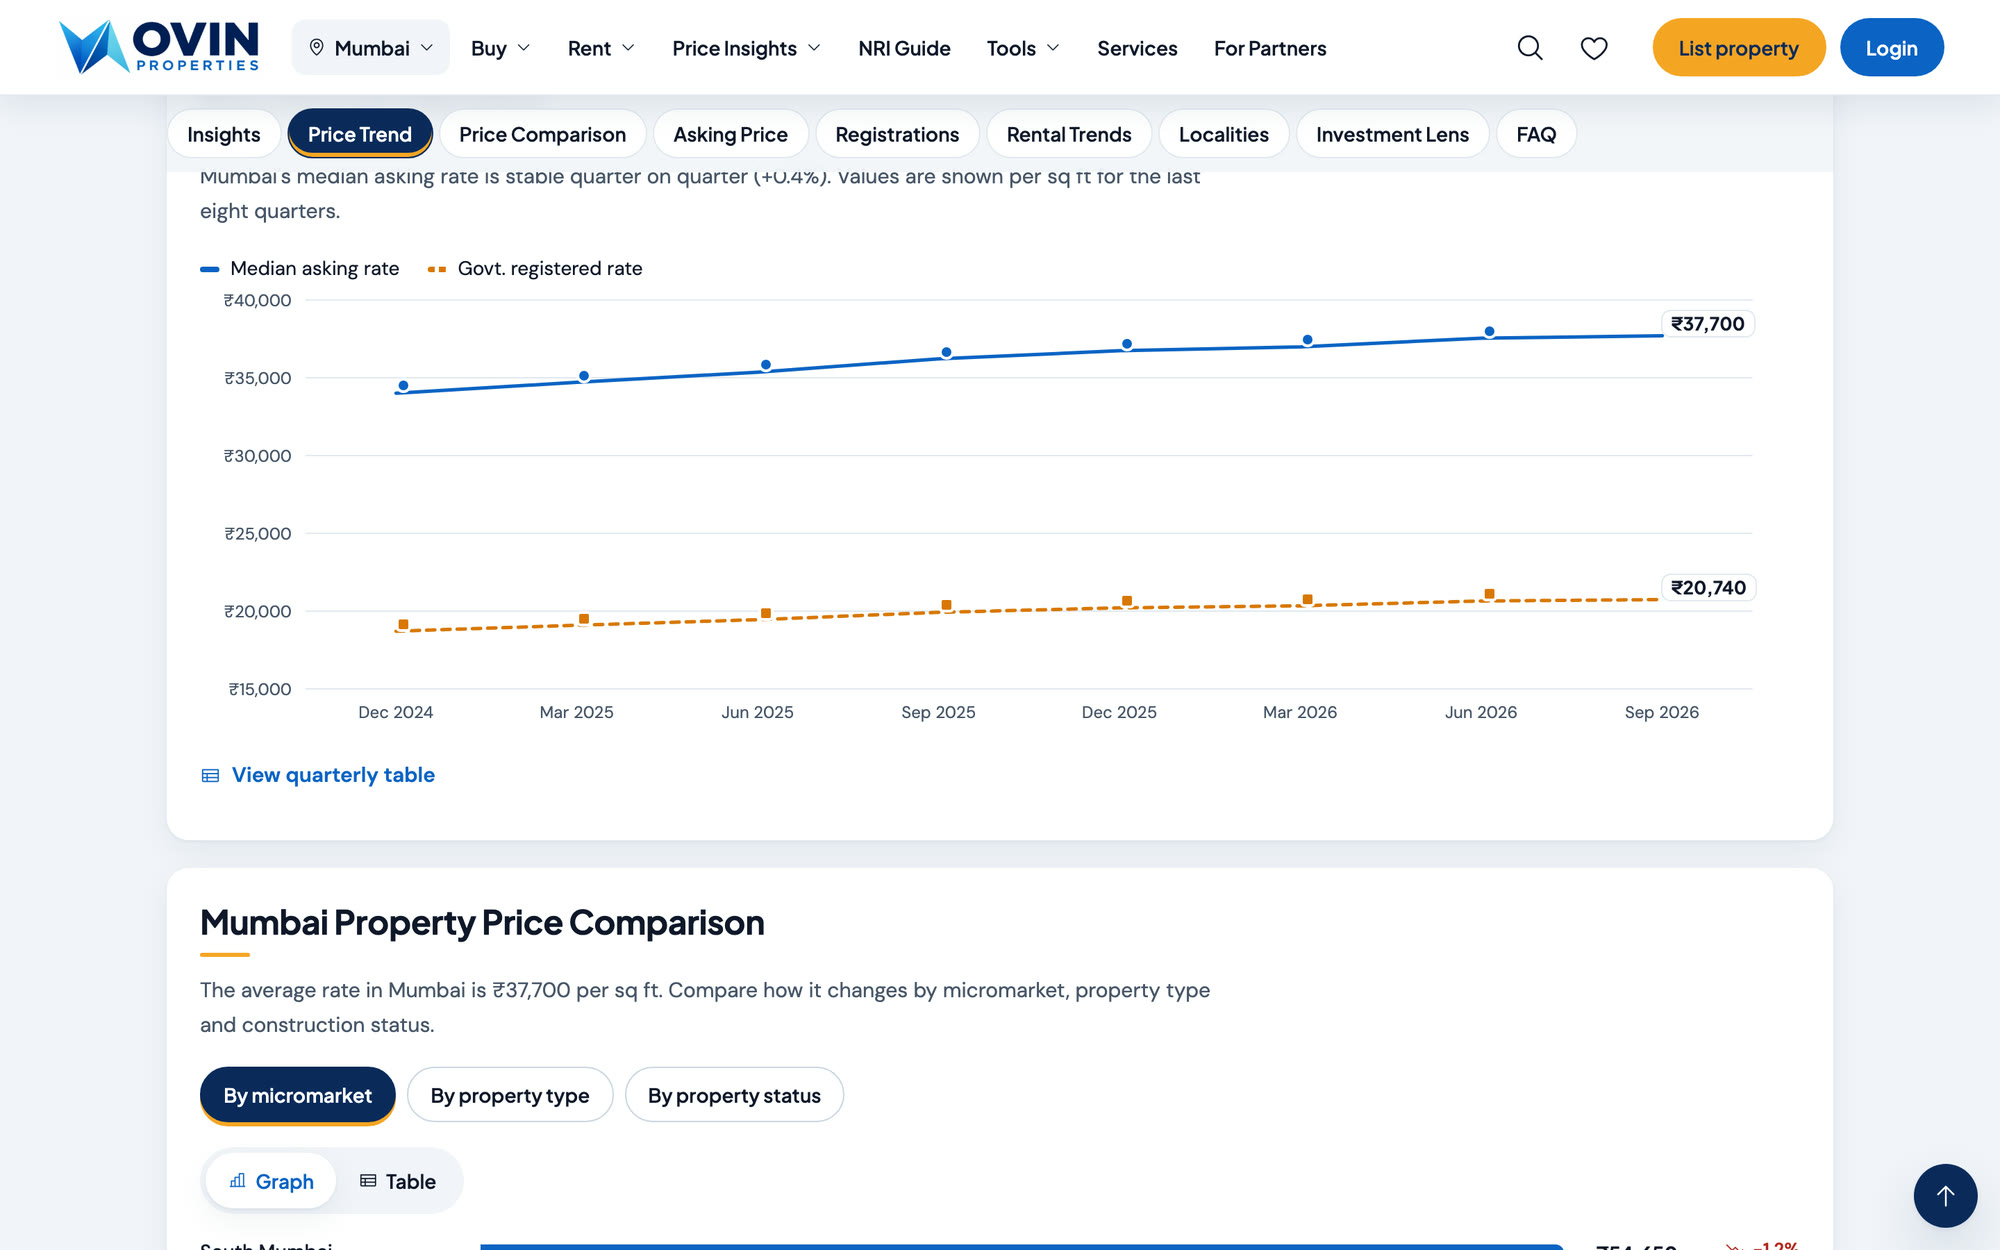
Every city has the same structure: four headline numbers, eight quarters of price trend, micromarkets, rents, top localities and an investment lens. Each chart can be switched to a table.
03 / 06
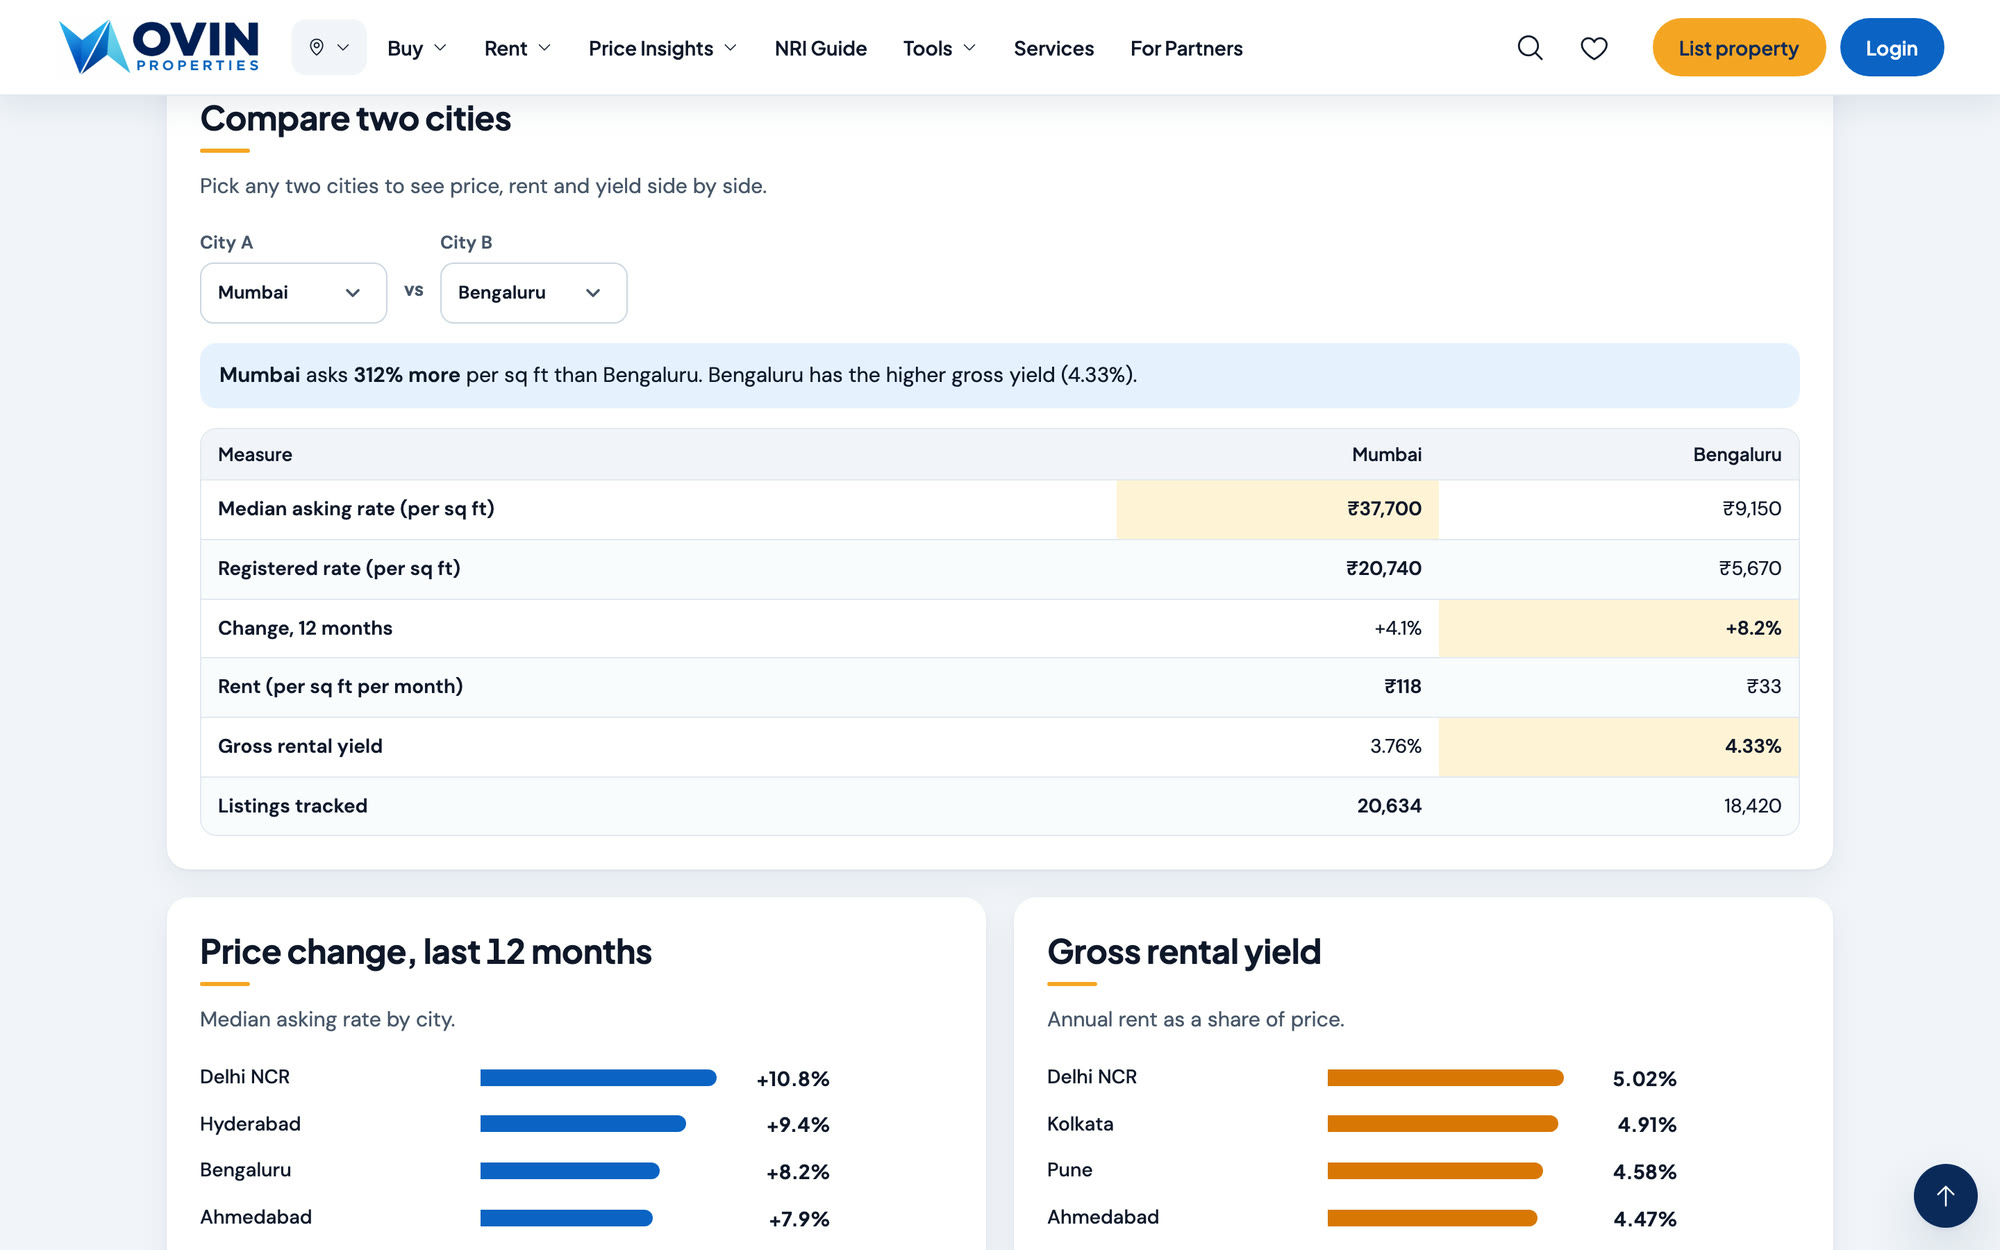
Choose any two cities and see price, rent, yield and recent change next to each other, with the stronger figure highlighted and a plain sentence that sums up the difference.
04 / 06
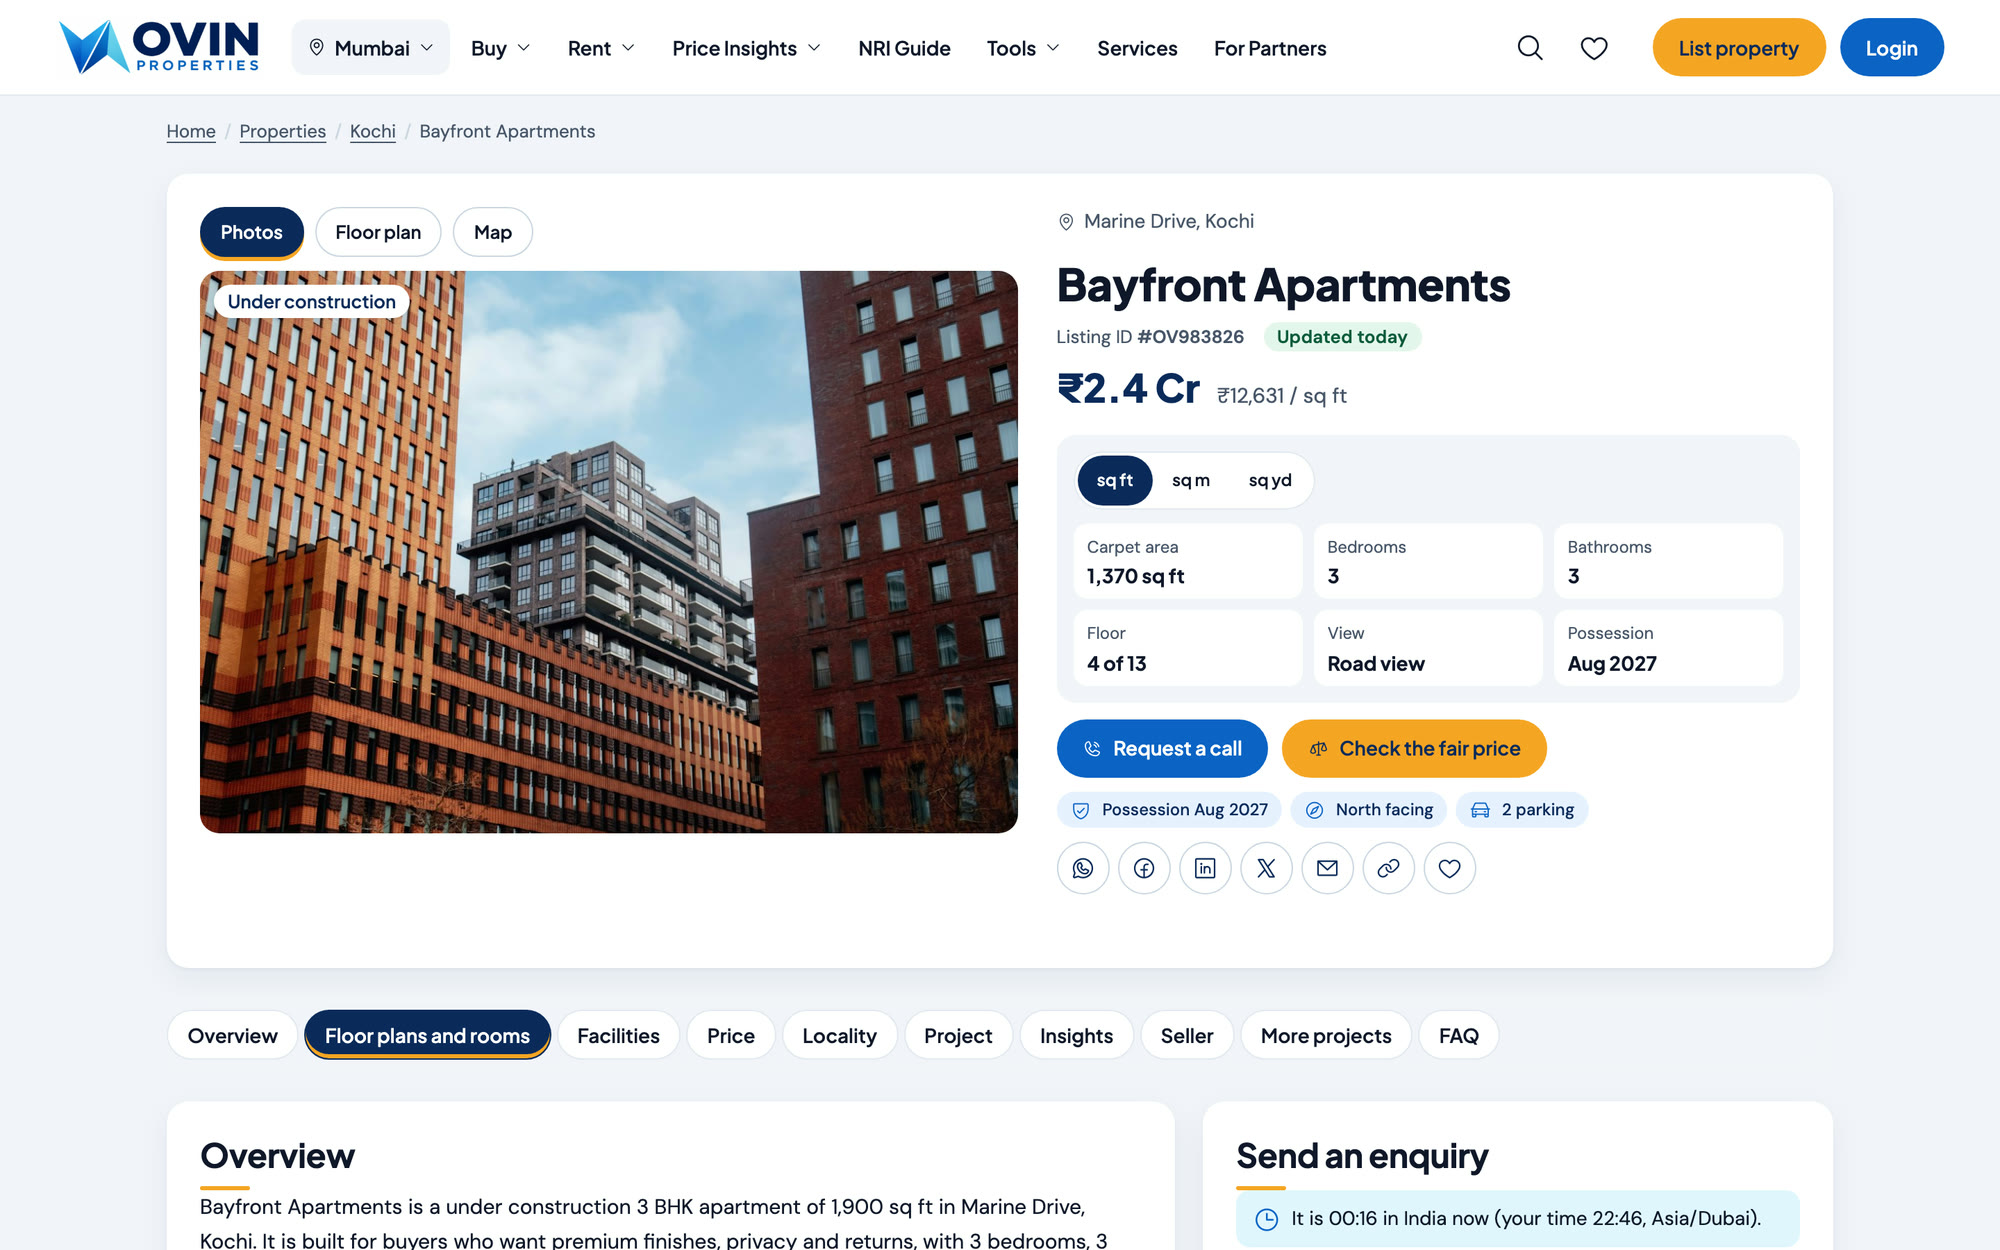
Photos, floor plans by BHK, pricing, payment plan, facilities, commute times, locality insights and the developer, all on one page. The enquiry form shows what time it is in India right now.
05 / 06
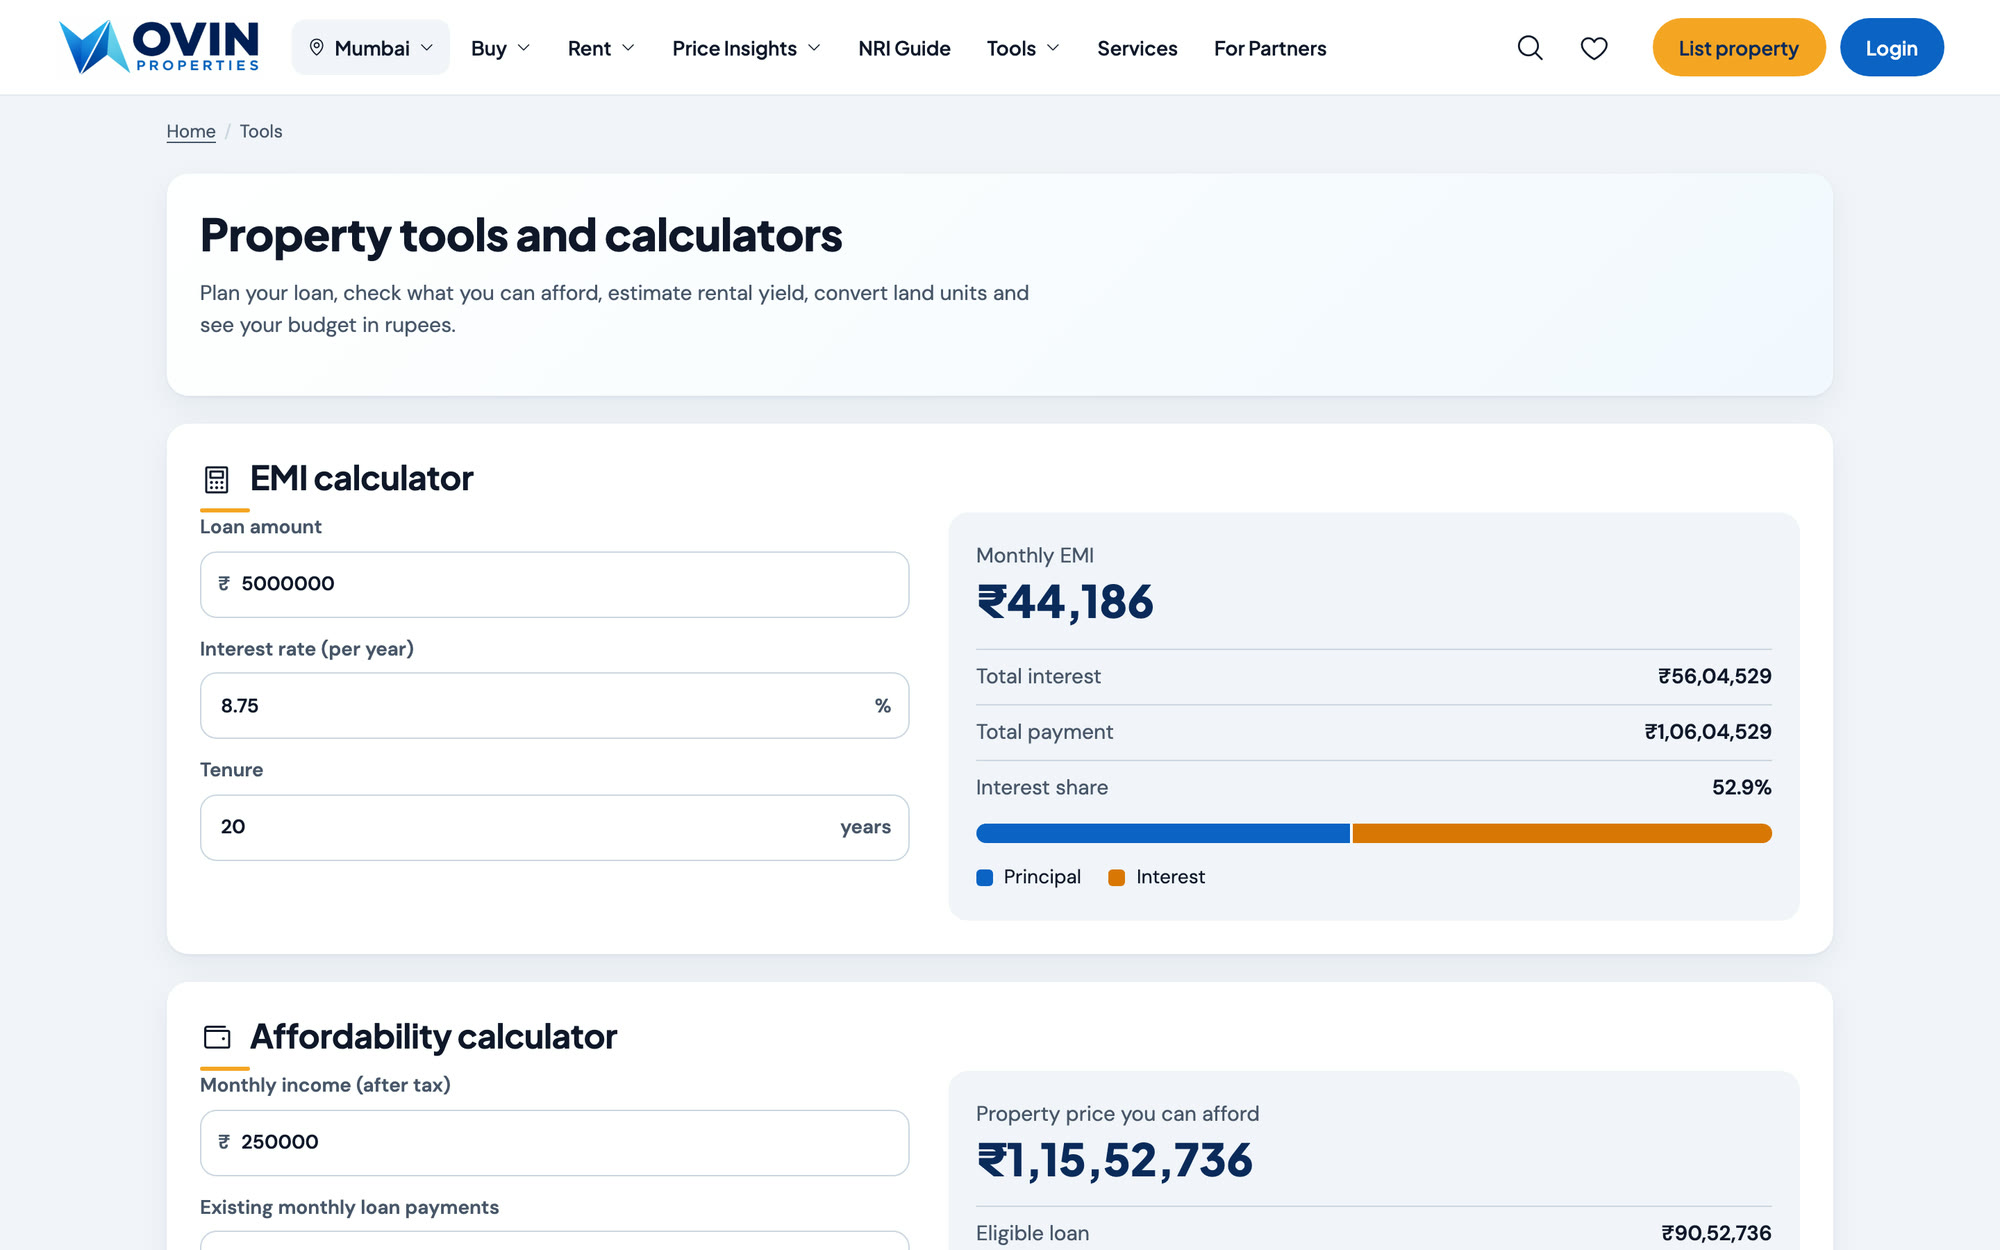
EMI, affordability, rental yield, area conversion and a budget in your own currency, each showing its working so buyers can trust the result.
06 / 06
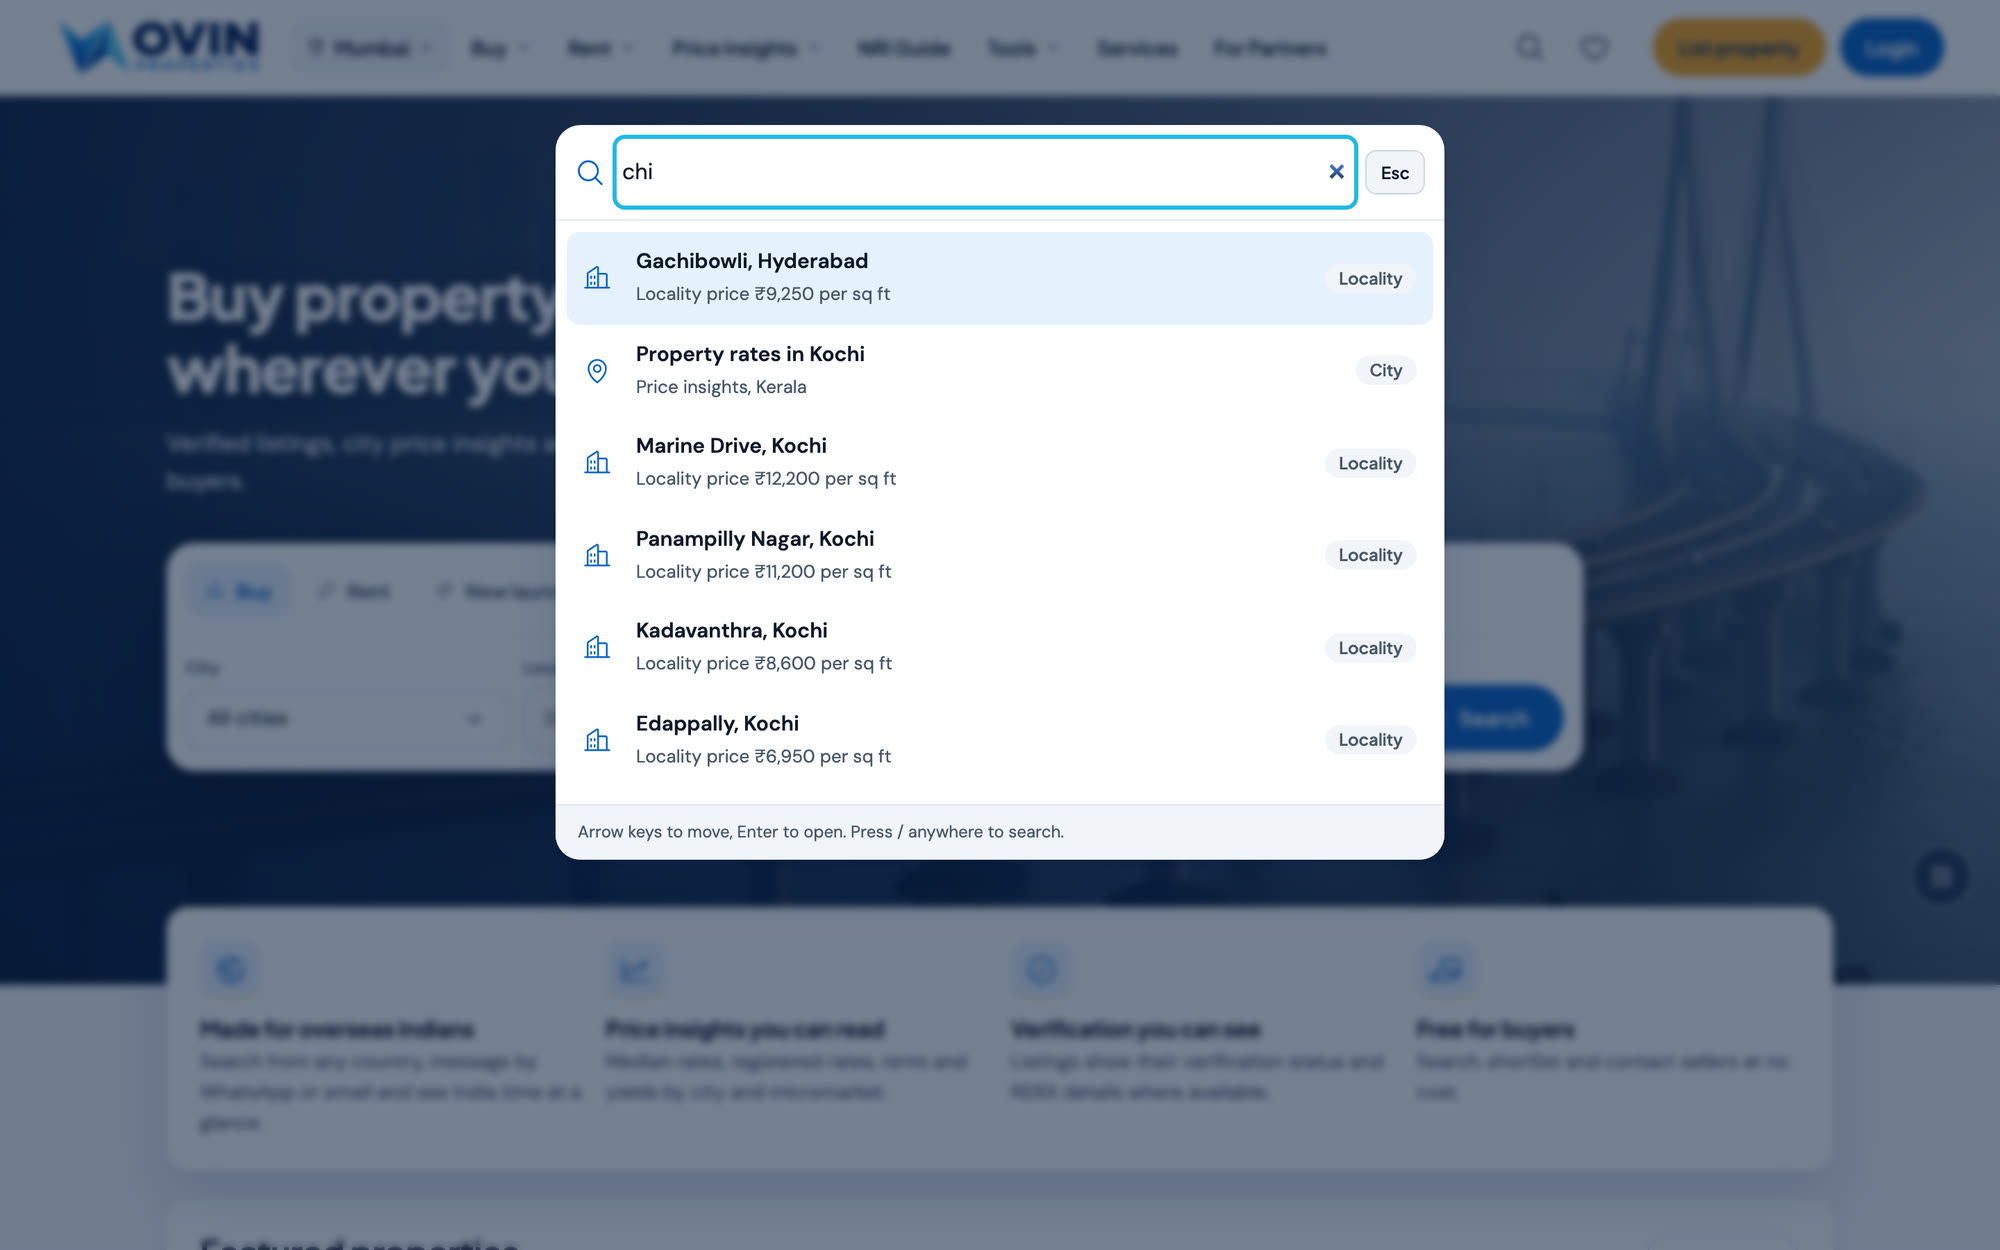
Press the slash key anywhere on the site to search across cities, localities, properties and guides, with results that show the price at a glance.
Every number comes from one data file, so connecting a live market feed updates the whole site at once.
Charts use plain labels, a colour-safe palette and a table view, so the numbers work for every visitor.
Time-zone aware enquiries, a currency budget tool and an NRI guide answer the questions overseas buyers ask first.
Static pages with no heavy framework load quickly on any connection, from Toronto to Kochi.